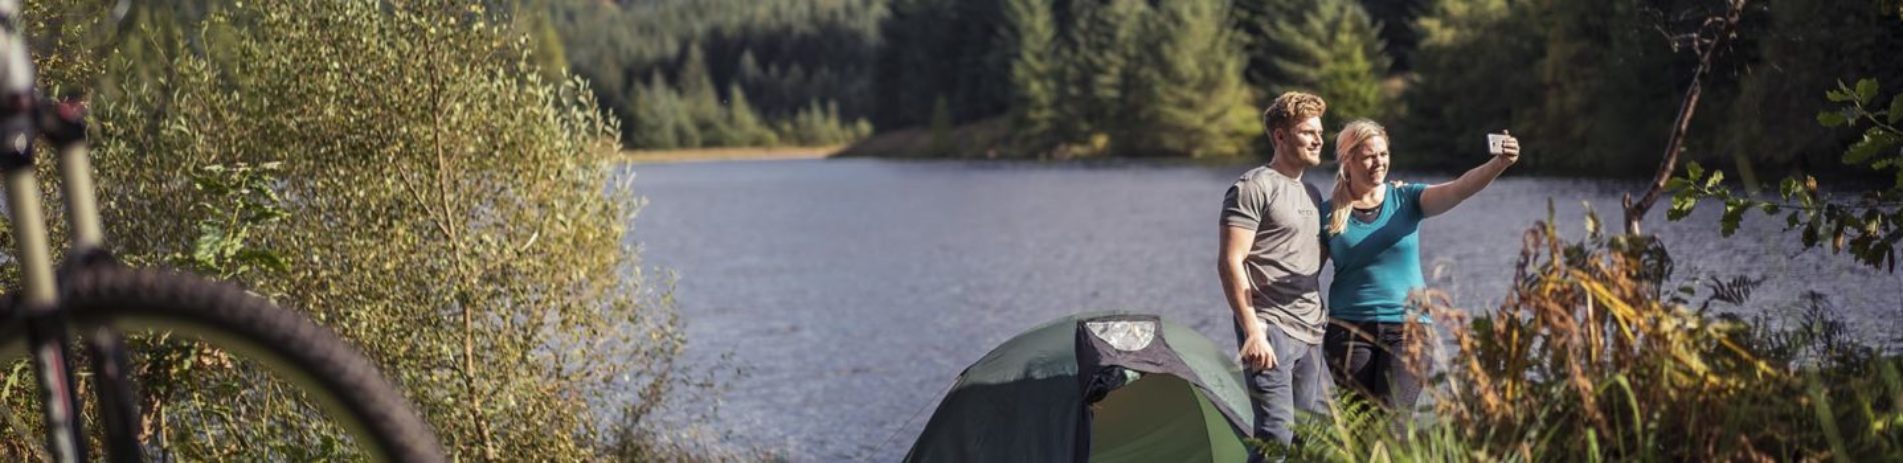
Indicator 8: Visitor experience
A review of delivery in the first three years of the plan (2018-21) has been carried out and you can read more in our main findings. This page looks at progress in year 1 of delivery (2018/19) only.
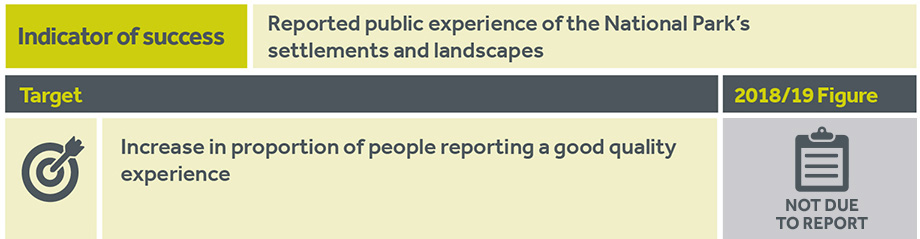
Table shows:
- Indicator of success – Reported public experience of the National Park’s settlements and landscapes.
- Target – Increase in proportion of people reporting a good quality experience.
- 2018/19 figure – Not due to report.
What does this tell us?
This Indicator is tracked through the National Park Visitor Survey which runs every five years. The Survey fieldwork is currently underway and due to report in autumn 2020, so this indicator will report in 2021.
The Visitor Survey is a year-long, National Park-wide survey to gather visitor profile and behaviour information, visitor feedback and trends from a sample of 2,400. One question within the Survey asks people to rate their overall experience to the area and the National Park Authority will use this question to track progress against this indicator. Responses to the 2015 survey saw 87% rating their overall visit at 8 out of 10 or above, in 2011 this figure was 80%.
As part of the analysis of responses to the current Survey, in order to see if there are differences in experience, the overall rating will be broken down by different groups of visitors and where the survey took place. We do not have this full analysis for the previous Visitor Surveys and the sizes of the relevant samples are perhaps too small to draw rigorous conclusions. Nonetheless, from the 2015 data that we do have, it is interesting to note that gender, age, ethnicity and social economic group did not appear to affect how respondents rated their visit. The 2019 Survey will allow us to fully apply such a breakdown and better understand any variances for the first time.
Feedback from campers
Whilst we await that report, information that is collected on an ongoing basis can be considered, namely the experiences of those camping at National Park Authority permit sites. While this is not comparable to the Visitor Survey, the feedback being designed to serve a different purpose and not covering all kinds of visitors, it does help us to understand the experience of some of the people visiting the National Park.
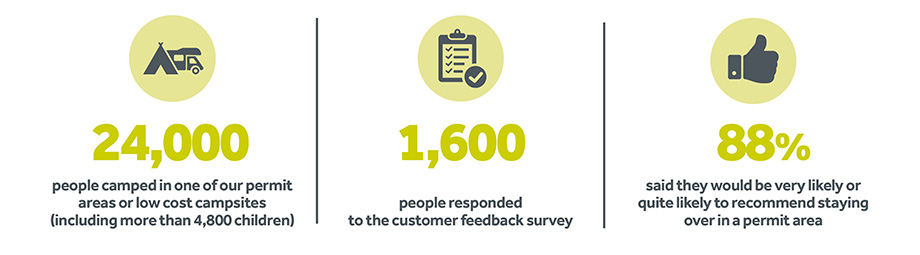
More than 24,000 people (including more than 4,800 children) camped within one of the camping permit areas or low cost campsites during the year and positive feedback was received from the majority of the 1,600 people who responded to the customer feedback survey, with 88% saying that they would be “very likely” (65%) or “quite likely” (23%) to recommend staying over in a permit area. This figure was 87% in 2017 (58% “very likely” and 29% “quite likely” to recommend). You can read more about this feedback.
Contribution to National Outcomes
Progress on this indicator contributes to the following National Outcomes:


Contribution to Sustainable Development Goals
Progress on this indicator contributes to the following Sustainable Development Goals:
Minor Contribution