Indicator 4: Water Body Condition
A review of delivery in the first three years of the plan (2018-21) has been carried out and you can read more in our main findings. This page looks at progress in year 1 of delivery (2018/19) only.
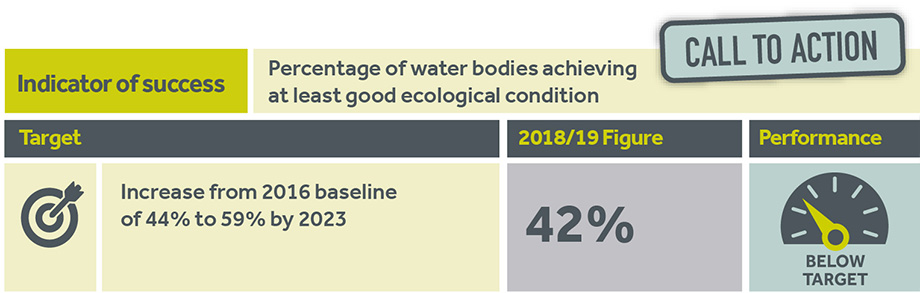
Table shows:
- Indicator of success – Percentage of water bodies achieving at least good ecological condition.
- Target – Increase from 2016 baseline of 44% to 59% by 2023.
- 2018/19 figure – 42%
- Performance – Below target
What does this tell us?
Between 2016 and 2017 the number of water bodies within the National Park with an overall condition of at least Good Ecological Potential, as classified by SEPA, has fallen from the baseline of 43 (44%) to 41 (42%). This represents lower than expected progress against the target.
The change in total number is due to two water bodies being upgraded in condition and four being downgraded in condition. From looking at the underlying causes of water bodies that were downgraded there seems to be a common issue with rural diffuse pollution, particularly increasing levels of phosphorous. These water bodies suffer from multiple pressures from land use such as run-off from agriculture and forestry as well as private sewage treatment impacts. Some of the water bodies that have remained in moderate or poor condition may well also share the same pressures. We see this as a call to action and plan to work in partnership to address it.
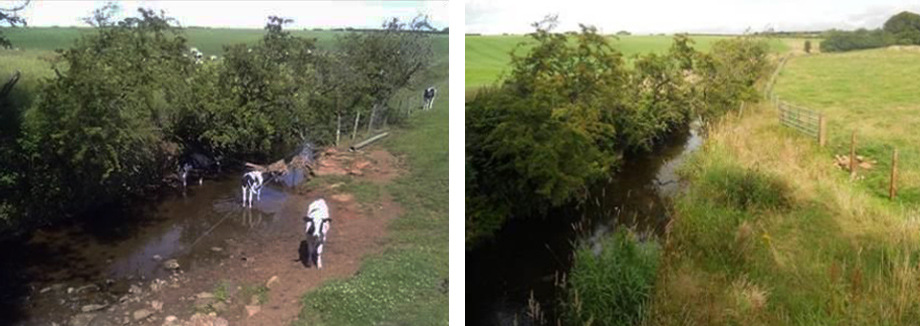
Before and after images showing the benefits of fencing to improve water condition in the National Park
Most of the other pressures experienced by water bodies within the National Park boundary are associated with activities that are regulated by SEPA, who work with the operators to investigate the environmental impacts and discuss appropriate measures and timescales to deliver improvements. As part of our Wild Park programme we are working to better understand the extent of environmental impact from barriers to fish migration in particular. It appears that some water bodies previously thought to have man-made barriers may in fact have natural ones, surveys are being carried out to determine the true status on the ground.
Please note that 2017 figures are the most recent results available due to the reporting cycle of water body condition monitoring. This indicator will continue to track results one year prior to the other Plan Indicators.
Contribution to National Outcomes
Progress on this indicator contributes to the following National Outcomes:


Contribution to Sustainable Development Goals
Progress on this indicator contributes to the following Sustainable Development Goals:
Significant contribution
Minor contribution