Indicator 5: Public and Active Travel
A review of delivery in the first three years of the plan (2018-21) has been carried out and you can read more in our main findings. This page looks at progress in year 1 of delivery (2018/19) only.
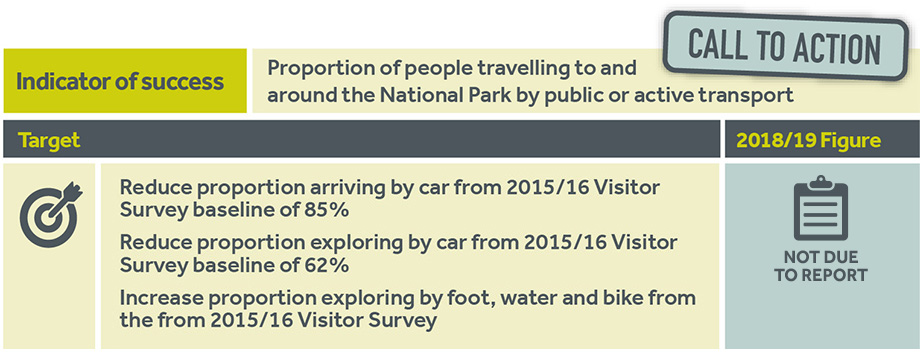
Table shows:
- Indicator of success – Proportion of people travelling to and around the National Park by public or active transport.
- Target – 1. Reduce proportion arriving by car from 2015/16 Visitor Survey baseline of 85%; 2. Reduce proportion exploring by car from 2015/16 Visitor Survey baseline of 62%; 3. Increase proportion exploring by foot, water and bike from the 2015/16 Visitor Survey.
- 2018/19 figure – Not due to report.
What does this tell us?
The National Park Visitor Survey runs every five years, fieldwork is currently underway and due to report in autumn 2020, so this indicator will report in 2021. The Visitor Survey is a year-long, National Park-wide survey to gather visitor profile and behaviour information, visitor feedback and trends from a sample of 2,400.
Whilst we await that report, information on some proxy measures can be considered. These aren’t comparable to the depth and rigour of the information we get from the Survey, but they do give a sense of the year’s activity. The following proxies are reported for 2018-19:
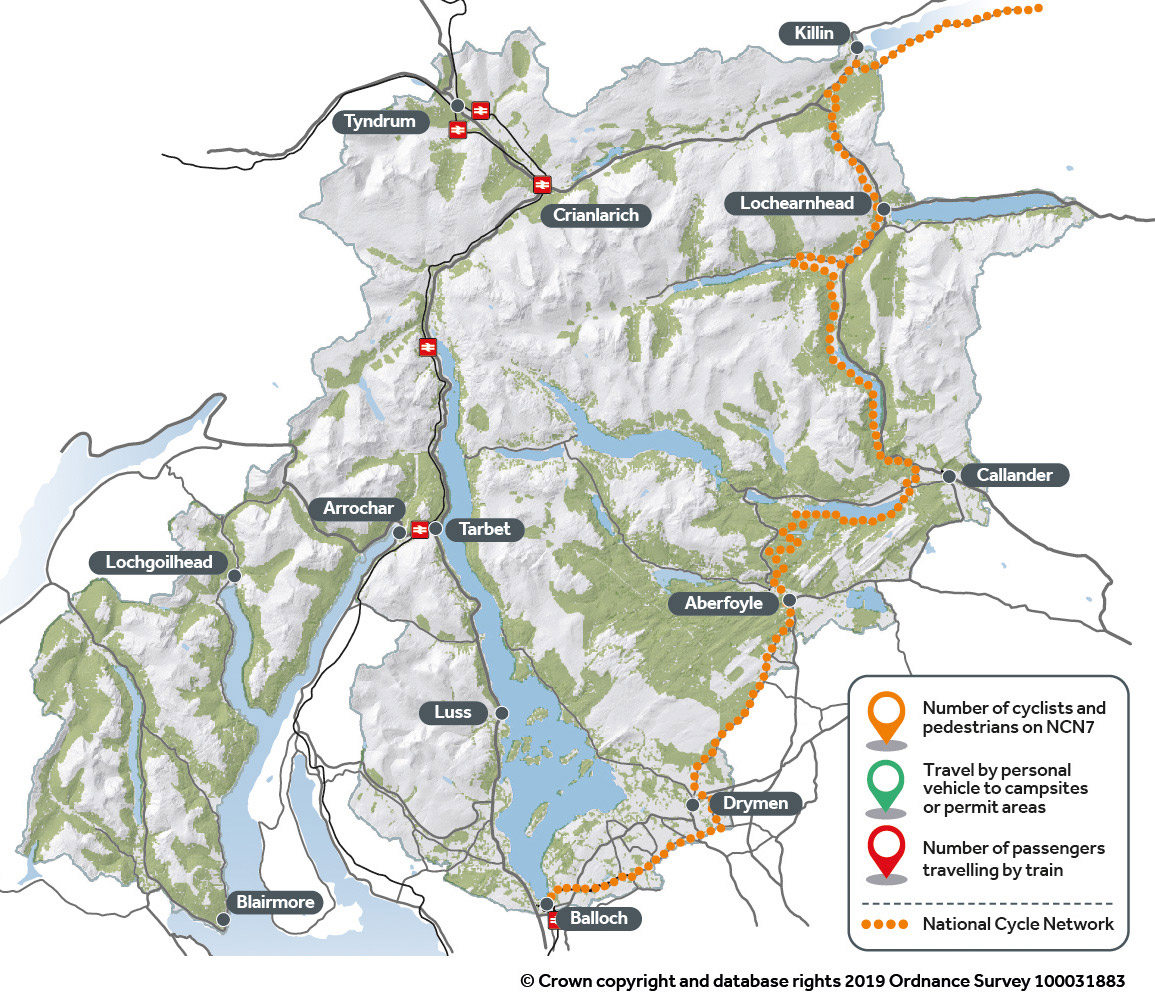
- Transport to our camping permit areas – In 2018-19 88% of bookings at our camping permit areas included a personal vehicle (car, motorbike, motorhome, van, or other vehicle), it was also 88% in 2017-18. (Please note that these figures are for the majority of trips made to permit areas as 89% of bookers disclosed transport mode in 2018-19 and 84% the previous year.)
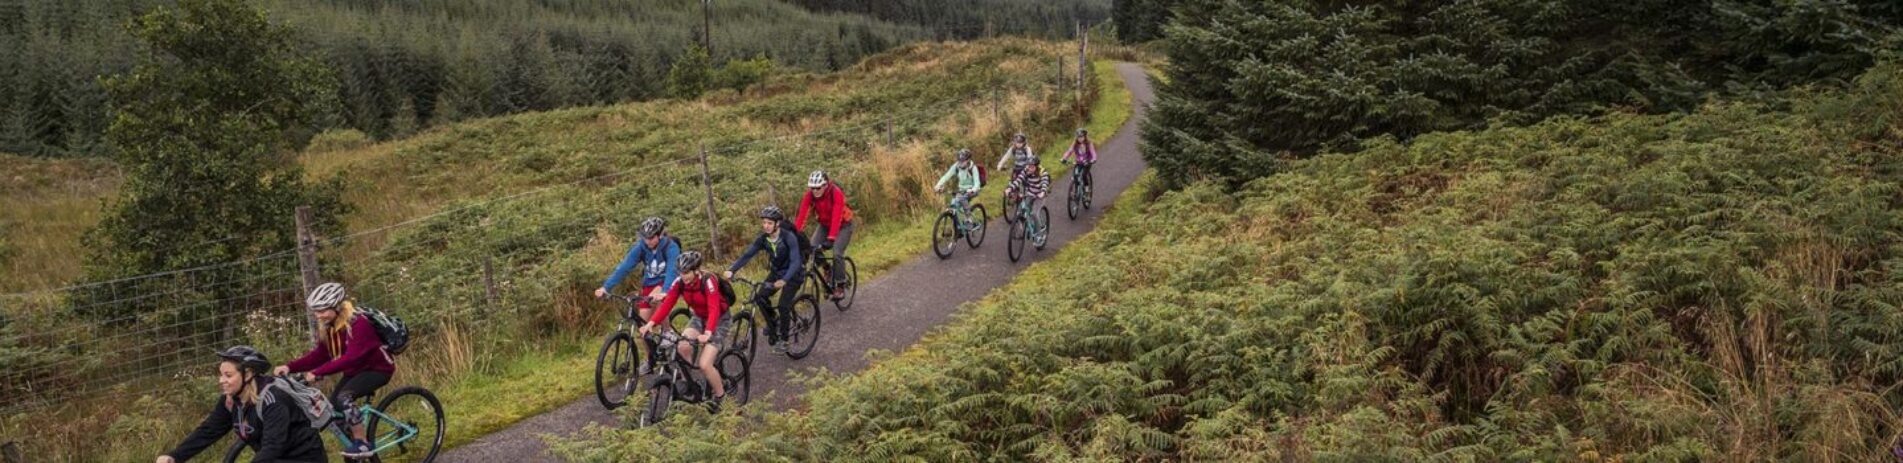
- National Walking and Cycling Network – This year saw more than 14,000 cyclists and 23,000 pedestrians using NCN route 7 which runs through the National Park, increasing from last year’s figures of more than 13,000 cyclists and 22,000 pedestrians.
- Train travel – There are six train stations within the National Park and since 2011-12 there has been an overall trend of increasing customer numbers. Figures recorded from April 2018 to March 2019 show that numbers are modest at each station (up to 20,000 passengers) except at Balloch which has more than 500,000 passengers.
Roll over the icons on the map to read more about each location.


These findings are limited, but even without a full report it seems highly likely that 2018-19 is still seeing strong car-dependency, in both travel to and around the National Park. It is of course promising to see the findings in cyclists, pedestrians and train travel, but without further information it cannot be inferred that these increases are in turn replacing car trips, they could be due to an increase in trips of all types or reflective of different kinds of journeys. It is interesting to note that the recent baseline report against the National Outcomes reported differences in satisfaction with public transport in Scotland’s remote and rural areas, with 79% satisfaction in large urban areas as compared to 48% in accessible rural areas.
We see this as a call to action, especially in light of the climate emergency. How do we both decarbonise and enhance transport provision in traditionally car-dependant rural areas? This is a challenge and an opportunity and will require strong partnership working across the National Park, and it will be part of the new strategic plan for outdoor recreation (including active travel) currently in development.
Contribution to National Outcomes
Progress on this indicator contributes to the following National Outcomes:


Contribution to Sustainable Development Goals
Progress on this indicator contributes to the following Sustainable Development Goals:
Significant contribution


Minor contribution