Skip to navigation
Menu
Search
young-volunteers-with-guide-looking-at-plants-all-wearing-blue

National Park Partnership Plan – Progress in Year 1

A review of delivery in the first three years of the plan (2018-21) has been carried out and you can read more in our main findings. This page looks at progress in year 1 of delivery (2018/19) only.

A suite of indicators was published with the National Park Partnership Plan to measure whether it is delivering what it set out to achieve and having a positive effect on the National Park. Explore each indicator in the table below to find out about the progress in year one of delivering the Plan, as well as other key findings and supporting information, or watch our video for a quick recap.


1. Area and condition of woodland


2000 hectares of woodland expansion by 2023


2. Area and condition of restored peatland


2000 hectares of restored peatland by 2023


3. Percentage of designated sites in favourable condition


Increase from 2017 baseline of 86% of designated site features to 90% by 2023


4. Percentage of water bodies achieving at least good ecological condition


Increase from 2016 baseline of 44% to 59% by 2023


5. Proportion of people travelling to and around the National Park by public or active transport


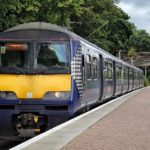
› Reduce proportion arriving by car from 2015/16 Visitor Survey baseline of 85%
› Reduce proportion exploring by car from 2015/16 Visitor Survey baseline of 62%
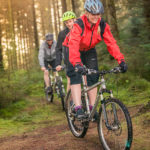
› Increase proportion exploring by foot, water and bike from the 2015/16 Visitor Survey


6. Proportion of people taking part in active recreation


Increase from 2015/16 Visitor Survey baselines of 24% for active sport and 49% for low-level walking


7. Overall value of the visitor economy


Increase from 2016 STEAM baseline of £340m by 2023


8. Reported public experience of the Park’s settlements and landscapes


Increase in proportion of people reporting a good quality experience


9. Number of volunteers and volunteer hours


Increase by 20% from the 2017/18 baseline by 2023


10. Number of young people having an outdoor learning experience in the National Park


At least 2500 young people per year over the Plan period


11. Number of new homes built and proportion of affordable homes


375 homes over the Plan period with a minimum of 25% being affordable


12. Number of projects delivering well-designed, sustainable places


Delivery in 3 communities per year of the Plan


13. Number of community-identified projects delivered


Delivery of 3 projects per Community Action Plan by 2023


14. Number of new skills development opportunities from projects in the National Park


Increase opportunities in the National Park over the Plan period

Back to top
Skip to content